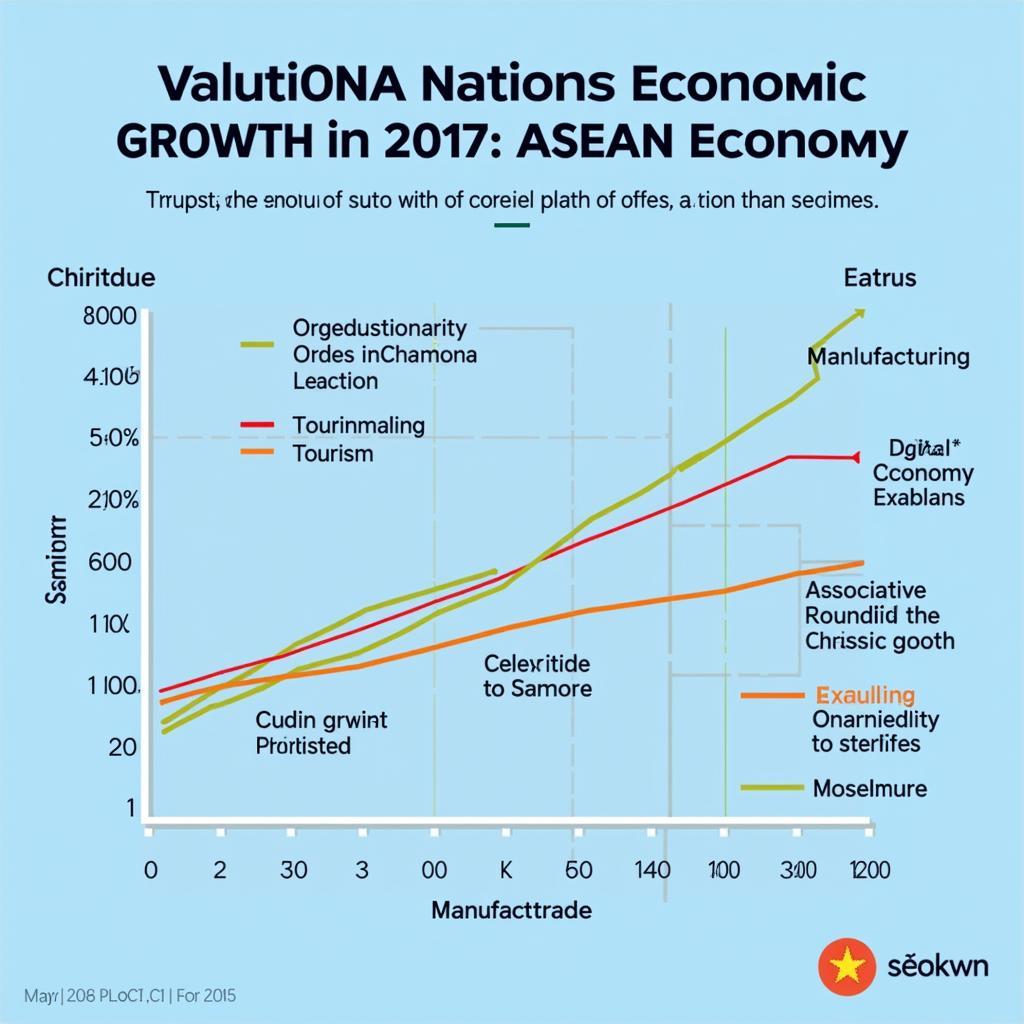
ASEAN L3 statistics encompass a crucial set of data that provides a detailed look into the economic performance and trade activities within the Association of Southeast Asian Nations (ASEAN). This data delves deeper than aggregate figures, offering insights into specific industries, products, and trade flows between ASEAN member states and their dialogue partners.
Deciphering the Significance of ASEAN L3 Statistics
ASEAN L3 statistics provide a granular perspective on trade patterns, going beyond broad classifications to reveal the nuances of individual product categories. This level of detail is essential for policymakers, businesses, and researchers to gain a comprehensive understanding of:
- Intra-ASEAN Trade: Identifying key industries driving regional integration and understanding the dynamics of trade relationships between member states.
- Extra-ASEAN Trade: Analyzing trade flows with major partners like China, the US, and Japan, revealing opportunities and challenges for ASEAN businesses in the global market.
- Investment Opportunities: Recognizing sectors with high growth potential and understanding the competitive landscape within specific industries.
- Policy Formulation: Providing evidence-based insights for formulating trade policies, negotiating trade agreements, and promoting economic development strategies.
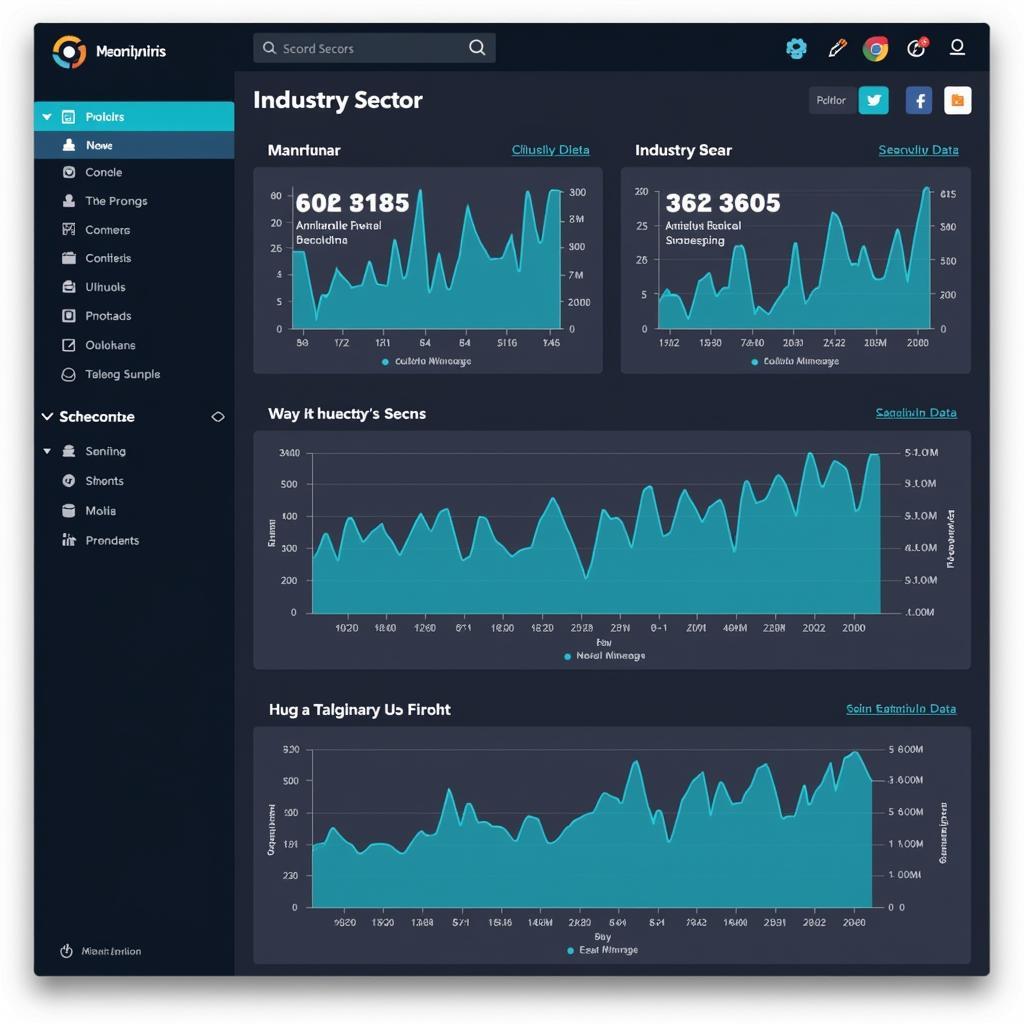
 Interactive Dashboard for Analyzing ASEAN L3 Statistics by Industry
Key Features and Applications of ASEAN L3 Statistics
ASEAN L3 statistics stand out due to their unique characteristics, making them an invaluable resource for various stakeholders:
- Harmonized System (HS) Codes: The use of standardized HS codes ensures consistency and comparability of data across different countries and reporting periods.
- Detailed Product Classifications: The data drills down to the 6-digit HS code level, offering insights into specific product categories and sub-categories.
- Time Series Data: Availability of historical data allows for trend analysis, forecasting future trade patterns, and identifying long-term shifts in trade dynamics.
- Coverage of Goods and Services: While primarily focused on merchandise trade, efforts are underway to expand coverage to include trade in services, providing a more holistic picture of economic activity.
Navigating the Challenges of ASEAN L3 Statistics
Despite their undeniable value, utilizing ASEAN L3 statistics effectively requires addressing certain challenges:
- Data Accessibility and Dissemination: Efforts are needed to improve the accessibility and timeliness of data releases, ensuring that stakeholders can readily access and utilize the information.
- Data Quality and Comparability: Harmonization efforts are ongoing to address inconsistencies in data collection and reporting methodologies across ASEAN member states.
- Analytical Capacity: Building capacity among stakeholders to effectively analyze and interpret complex trade data is crucial for extracting meaningful insights.
 Experts Discussing ASEAN L3 Statistics at an Economic Forum
Conclusion: Unlocking ASEAN’s Potential through Data-Driven Insights
ASEAN L3 statistics are an indispensable tool for navigating the complexities of Southeast Asia’s dynamic economic landscape. By providing granular insights into trade patterns and industry dynamics, these data empower stakeholders to make informed decisions, foster regional integration, and unlock the full potential of ASEAN’s economic growth.
For assistance in understanding and utilizing ASEAN L3 statistics, contact us at Phone Number: 0369020373, Email: [email protected] Or visit us at: Thôn Ngọc Liễn, Hiệp Hòa, Bắc Giang, Vietnam. Our dedicated team is available 24/7 to provide support.


