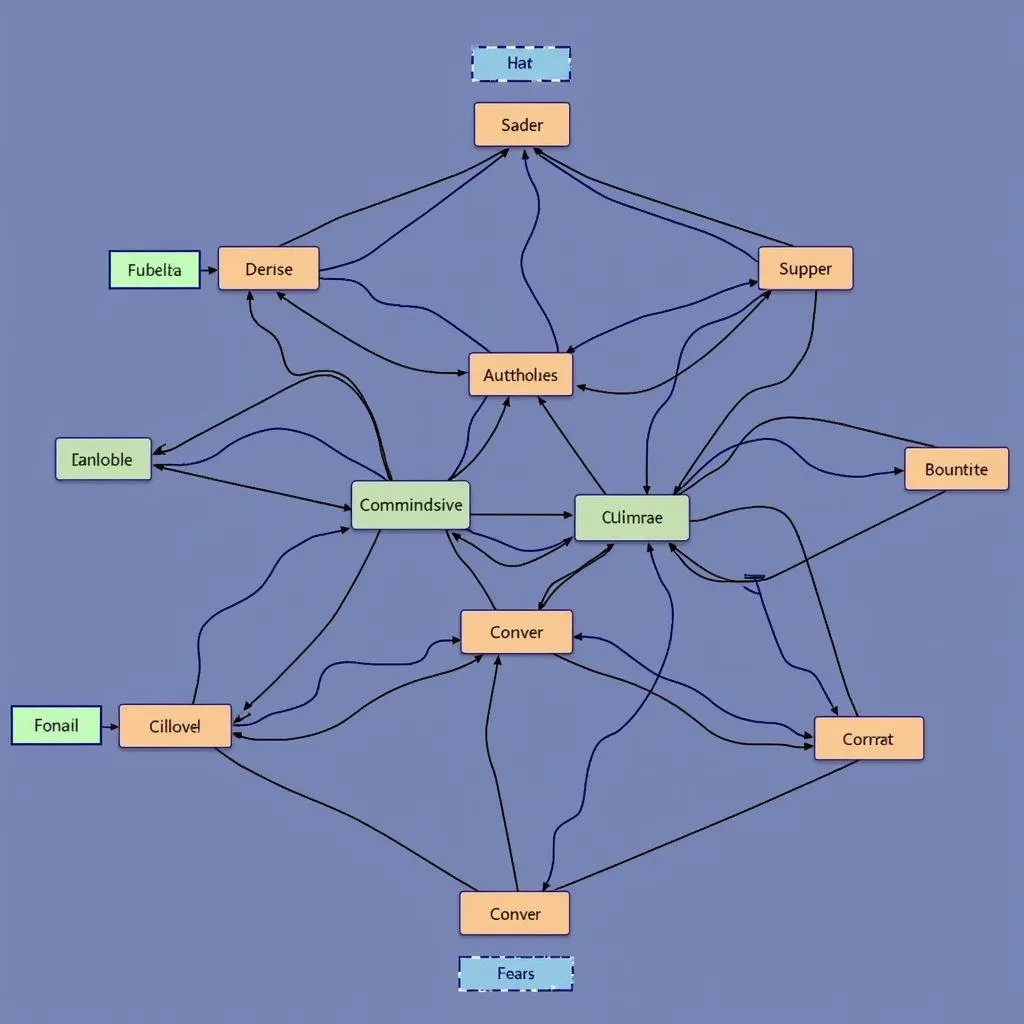
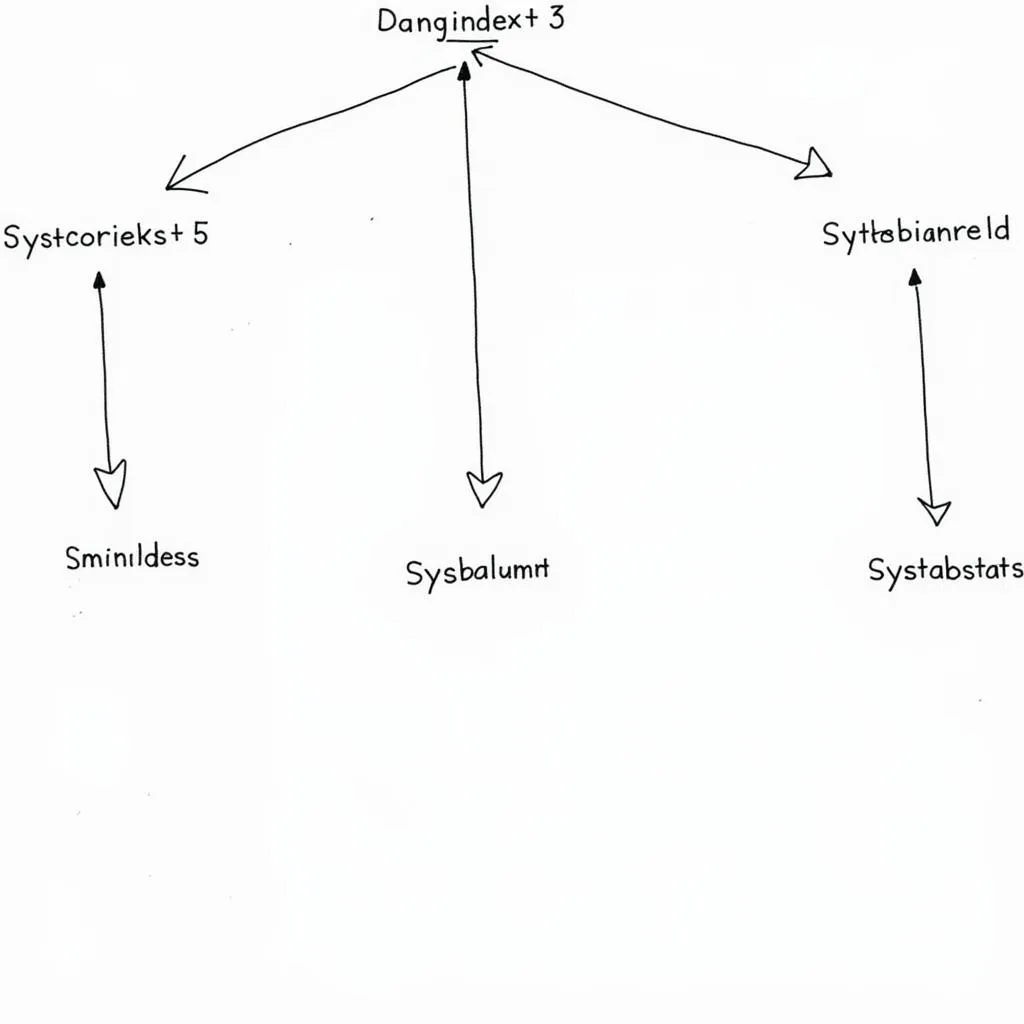
The Ase 16 System Tables Diagram provides a comprehensive visual representation of the relationships between various system tables within the Sybase Adaptive Server Enterprise (ASE) 16 database management system. This diagram is an invaluable resource for database administrators, developers, and anyone looking to understand the inner workings of ASE 16’s system catalog.
Navigating the ASE 16 System Tables Diagram
The diagram typically depicts tables as boxes with their names clearly labeled. Lines connecting the boxes represent relationships between tables, with arrows indicating the direction of the relationship. For instance, a one-to-many relationship between table A and table B would be shown with an arrow pointing from table A to table B.
 ASE 16 System Tables Diagram
Key System Tables and Their Relationships
While the specific tables and relationships shown on the diagram may vary depending on the version and source, some common ones include:
- sysobjects: This table is central to the ASE 16 system catalog, storing metadata about all database objects like tables, views, procedures, and triggers.
- syscolumns: This table contains information about columns within database objects. Each row corresponds to a column in a specific table, view, or other objects.
- sysindexes: This table stores information about indexes created on tables. It includes details like index type, indexed columns, and storage properties.
- systabstats: This table provides statistical information about tables, which is crucial for the query optimizer to generate efficient execution plans.
 Relationships Between sysobjects and Other Tables
Using the ASE 16 System Tables Diagram
The diagram serves as a roadmap for navigating the system catalog and understanding how data is organized within ASE 16. By understanding the relationships between tables, you can:
- Retrieve specific information about database objects: For example, you can use the diagram to determine which tables to query to find all indexes associated with a specific table.
- Troubleshoot database issues: The diagram can help you identify potential data integrity issues or performance bottlenecks by analyzing the relationships between different objects.
- Develop database applications: Understanding the system catalog is crucial for developing applications that interact with the database effectively.
Conclusion
The ASE 16 system tables diagram is a powerful tool for understanding the underlying structure of your Sybase database. By familiarizing yourself with this diagram and the relationships it depicts, you can gain valuable insights into your data and optimize your database operations.
Need assistance with your ASE 16 database? Contact us at Phone Number: 0369020373, Email: [email protected] or visit our office at Thôn Ngọc Liễn, Hiệp Hòa, Bắc Giang, Việt Nam. We offer 24/7 customer support.