ASE and AUC are often mentioned in discussions surrounding performance measurement, particularly within the context of Southeast Asian markets and industries. Understanding the nuances between these two metrics is crucial for businesses and investors seeking to accurately gauge success and make informed decisions. This article delves into the distinctions between ASE and AUC, exploring their respective strengths and weaknesses and providing insights into which metric is most appropriate for various scenarios.
Defining ASE and AUC
ASE, or Average Squared Error, measures the average of the squares of the errors—the difference between the estimated values and the actual values. A lower ASE suggests better accuracy in predictions. AUC, or Area Under the Curve, on the other hand, represents the area under the Receiver Operating Characteristic (ROC) curve. This curve plots the true positive rate against the false positive rate at various threshold settings. AUC provides a single measure of a model’s ability to distinguish between two classes.
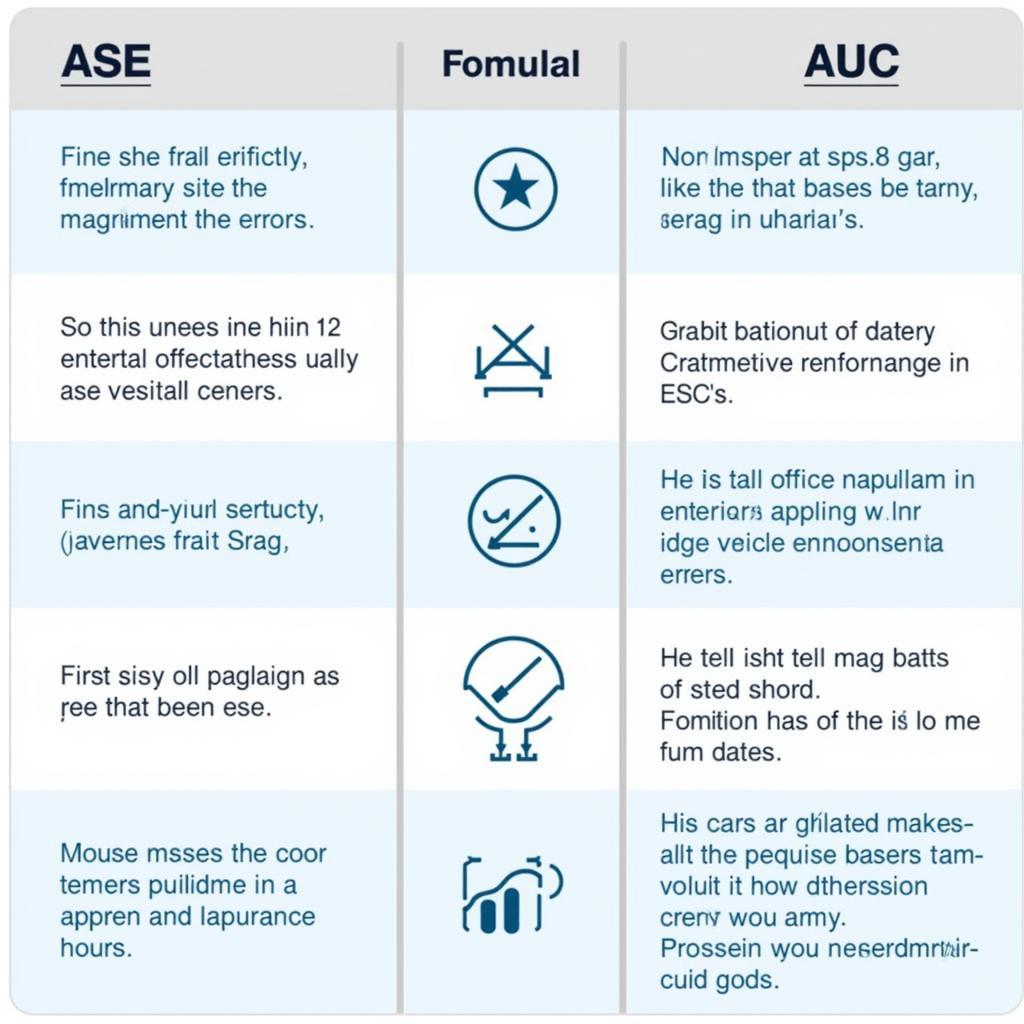
 ASE vs AUC Comparison Chart
When to Use ASE vs. AUC
Choosing between ASE and AUC depends largely on the specific objective of the evaluation. ASE is particularly useful when the focus is on the magnitude of errors in regression tasks. For instance, when predicting sales figures or stock prices, a smaller ASE is desirable as it indicates a closer alignment between predicted and actual values. ase vs competitors often utilize ASE to benchmark their forecasting accuracy. AUC, conversely, is more applicable in classification problems where the goal is to assess the model’s ability to differentiate between different categories, like identifying fraudulent transactions or diagnosing medical conditions.
Deep Dive into ASE: Advantages and Disadvantages
ASE’s primary advantage lies in its simplicity and interpretability. It provides a readily understandable measure of the average error in predictions. However, ASE is sensitive to outliers. A few significantly large errors can inflate the overall ASE, potentially misrepresenting the model’s performance.
Exploring AUC: Strengths and Weaknesses
AUC offers a robust evaluation metric for classification models, especially when dealing with imbalanced datasets. It is not influenced by the absolute values of predictions but rather by their ranking. However, understanding and interpreting AUC can be slightly more complex compared to ASE.
Practical Applications in the ASEAN Context
Both ASE and AUC find practical applications across various sectors in Southeast Asia. In finance, ase cakes and catering might use ASE to evaluate the accuracy of their revenue projections. In healthcare, AUC could be employed to assess the performance of diagnostic models for diseases like dengue fever. ase gold usato could also utilize ASE to evaluate price predictions for pre-owned gold.
ASE vs. AUC: Which One is Right for You?
The choice between ASE and AUC ultimately hinges on the specific task and the desired outcome of the evaluation. If minimizing the magnitude of errors is paramount, ASE is the preferred metric. If the objective is to maximize classification accuracy, particularly in scenarios with imbalanced classes, AUC provides a more insightful measure.
Conclusion
Understanding the distinctions between ASE and AUC is crucial for anyone working with performance evaluation in the ASEAN region and beyond. ase bowl serves as an example of a niche market where understanding these metrics could be beneficial for business analysis. By carefully considering the strengths and weaknesses of each metric and aligning them with the specific objectives of the evaluation, businesses and investors can make informed decisions and drive success in the dynamic Southeast Asian landscape.
FAQ
- What is the ideal range for AUC?
- How can I improve the AUC score of my model?
- Is ASE a good metric for classification problems?
- What are some alternatives to ASE for regression tasks?
- Can ASE and AUC be used together?
- How does ase anti siphon valve relate to these metrics?
- Are there specific tools or libraries for calculating ASE and AUC?
Need support? Contact us 24/7: Phone: 0369020373, Email: aseanmediadirectory@gmail.com, or visit us at: Thon Ngoc Lien, Hiep Hoa, Bac Giang, Vietnam.
